

Hello again, data enthusiasts! It’s time to get our hands dirty with some serious data crunching as we delve deeper into the powerful world of Power Query. In our last article, we touched on the basic features of Power Query. Now, let’s kick things up a notch and explore some commonly used options that can make data import a breeze.
1. Power Query Overview
Just to quickly refresh, Power Query is an Excel add-in that’s all about data connection and transformation. It lets you connect to a myriad of data sources, import data, and perform a variety of transformations right within the Power Query Editor window before loading it into Excel. The beautiful thing about Power Query is that it records every transformation step you take, which you can rerun anytime—imagine the time saved!
If you were here for the previous post about getting data into Excel, most of those “get data” options can be routed through Power Query.
2. Connecting to Different Data Sources
Power Query can connect to more data sources than you can shake a stick at. You can import from standard files (like Excel, Text/CSV, XML, JSON), databases (SQL Server, Access, Oracle, and many more), Azure services, online services (like SharePoint, Dynamics 365), and even web pages. This extensive range of connectivity ensures that regardless of where your data resides, Power Query can get it.
To connect to a data source:
- Go to the ‘Data’ tab > ‘Get Data’ > ‘From [Data Source Type]’.
- Choose your specific data source and follow the prompts to complete the process.
3. Power Query Editor: Your Data Playground
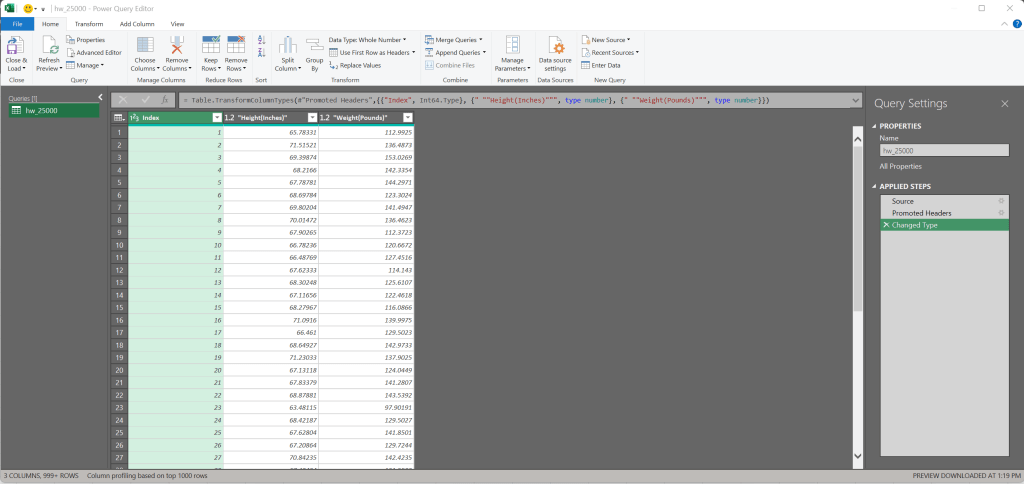
Once you’ve connected to a data source, Power Query presents your data in the Power Query Editor. Here’s where the magic happens, and you’ve got a ton of transformation options. The Power Query Editor is split into three main areas:
- The Ribbon: Contains multiple tabs with commands for various operations you can perform on your data.
- The Query Settings: Displays the applied steps and allows you to modify the query properties.
- The Preview Grid: Shows a preview of your data as it goes through transformations.
4. Query Transformations

The ‘Transform’ tab in the Power Query Editor is where most of the transformation action takes place. It’s packed with options for modifying your data:
- Text Transformations: Power Query provides numerous text transformations, including formatting changes, trimming, adding prefixes or suffixes, and extracting lengths.
- Number Transformations: If you’re dealing with numeric data, Power Query can perform mathematical operations, rounding, and even statistical computations.
- Date and Time Transformations: You can perform a wide range of transformations on date and time fields, including extracting parts of dates, calculating durations, and adjusting time zones.
- Structural Transformations: You can change the structure of your data with operations such as pivoting/unpivoting columns, transposing tables, and expanding nested data.
5. Combine Queries

An often-used feature in Power Query is the ability to combine queries. This feature is beneficial when dealing with multiple datasets that need to be consolidated into one:
- Append: If you have several tables with the same columns but different rows (like monthly sales data), you can append them into a single table.
- Merge: If you have related data across multiple tables (like orders and customers), you can merge them based on common columns (like customer id).
6. Conditional Columns and Custom Columns

Sometimes, you need to create new columns based on conditions or calculations. That’s where Conditional Columns and Custom Columns come in. You can define logic for these columns using a dialog box or, for more advanced cases, the M formula language.
7. Data Types and Formats
Power Query lets you specify the data type for each column in your data. This is crucial because it determines what operations can be performed on the data. For example, you can only perform arithmetic operations on numeric data types. The most common data types are Text, Whole Number, Decimal Number, Date/Time, and Boolean (true/false).
Additionally, you can format date and time columns to display the data in a specific format. This can be handy when you want the date or time to appear in a particular way in your final report.
8. Using the Advanced Editor
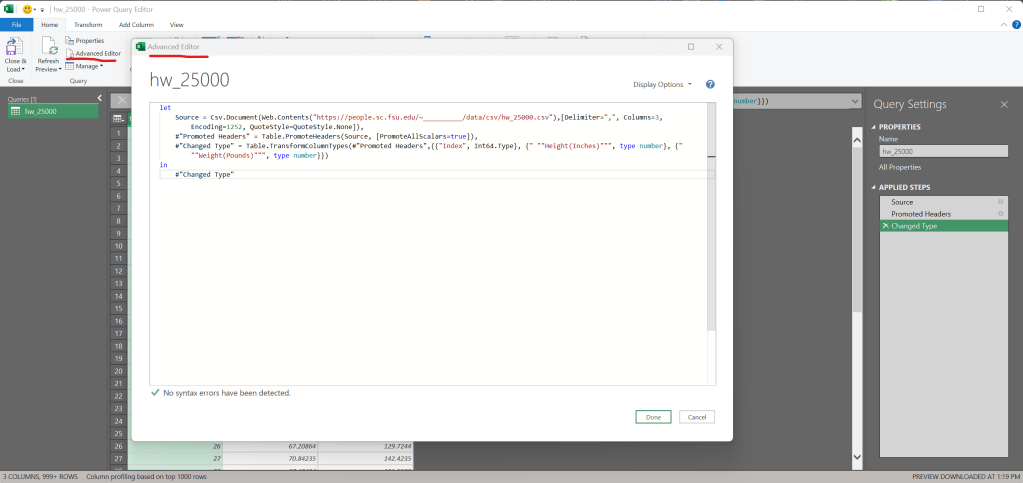
For those who enjoy getting their hands a bit more code-ish, Power Query offers the Advanced Editor. It’s here where you can see (and edit) the M code that’s generated by each step you take in the Query Editor. This provides an enormous amount of flexibility and control over your data transformations, although it does require some understanding of the M language. Microsoft actually has pretty solid documentation on M, so I likely won’t be diving into the syntax here, but will instead direct you to the official documentation page.
9. Loading the Data
Once you’ve performed all the transformations, you’re ready to load the data into Excel. Just hit the ‘Close & Load’ button on the Home tab, and Power Query will load the data into a new worksheet in your Excel workbook.
But before you do, you might want to consider where you’re loading the data. If you’re dealing with large volumes of data, you might want to load the data to the Data Model, which can handle millions of rows more efficiently than Excel sheets. You also have the option to load the data directly into a PivotTable or PivotChart.
10. Refreshing the Data
One of the most powerful aspects of Power Query is the ability to refresh the data. Since Power Query saves each step you take when importing and transforming your data, you can refresh the data whenever the source data changes and all those steps will be automatically reapplied.
To refresh the data, you simply right-click anywhere in your data and choose ‘Refresh’, or you can use the ‘Refresh All’ option in the ‘Data’ tab on Excel’s Ribbon. This ensures that your Excel reports or analyses always reflect the most recent data.
Wrap Up
And there you have it, folks – a crash course to get you started and provide a look at the commonly used features of Power Query. While there’s a lot to take in, remember that the best way to get comfortable with Power Query is to roll up your sleeves and play around with it. Connect to a data source, transform it, load it, and see what happens.
Remember, Power Query is designed to make your data import and transformation processes more efficient and easily repeatable. So, dive in, experiment, and watch as your data wrangling processes become more streamlined than ever before. Until next time, happy querying!
If you’re curious about Power Query in general, and want more information on any of the topics we’ve covered above, either stay tuned here for when we get to more detailed and specific examples, or head on over to the Power Query Documentation on Microsoft Learn.


Leave a comment